Investing
Fair Value Gap (FVG): The ICT Trading Tool

Did you know that within the ICT trading methodology, there is a very specific candlestick pattern that reveals fundamental information to traders?

We're talking about the Fair Value Gap pattern – and for those who follow this trading approach, it’s more than just a visual cue. It’s a key insight into the footprints left by major market players when they rapidly add or pull liquidity, leading to sharp price movements in one direction or another.
Understanding how to read these patterns forms a core part of what is technical analysis, a method that helps traders forecast future price movements using historical market data. In this article, we’ll explore this strategy step by step, including how to identify and trade FVGs effectively using the best trading platforms available for precision and flexibility.
What is the Fair Value Gap in ICT?
The Fair Value Gap (FVG) is, simply put, a liquidity imbalance that appears when price moves sharply, leaving a sort of "gap" or void between candlesticks. In line with the ICT trading methodology, this gap marks a point where a fair exchange between buyers and sellers didn’t take place – suggesting that the market may return to that level to “fill” it.
More technically, a Fair Value Gap (FVG) forms when there is a strong, impulsive price movement that leaves a single direction, which can be:
- Bearish FVG: between the low and the high of the candlestick
- Bullish FVG: between the high of one candlestick and the low of the next.
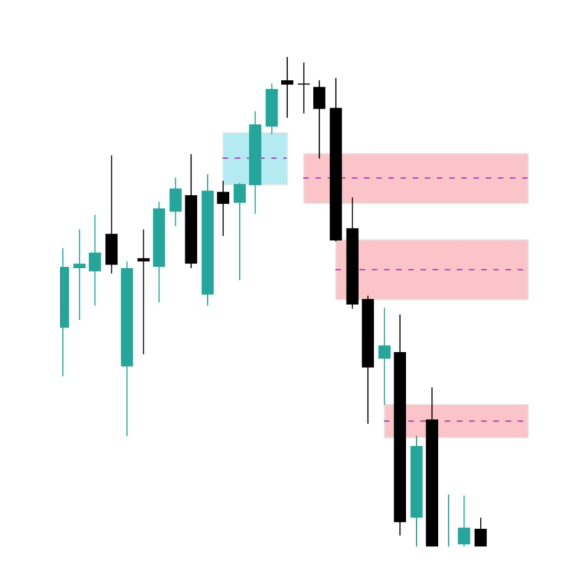
This type of structure indicates momentum, imbalance, and most importantly: Intention. In the following image of the Nasdaq on the daily TF, there are 4 marked FVGs. The first (blue) is bullish while the next three (red) are bearish.
How does FVG work?
A Fair Value Gap (FVG) is a price imbalance left behind when the market moves rapidly in one direction, usually due to institutional buying or selling. It reflects a zone where not all buy or sell orders were filled, suggesting the market may return to that level to “rebalance” or fill the gap.
What Actually Happens?
FVGs typically appear on a chart when there’s a large impulsive move and the price skips over a range without trading there. This creates a gap between the first and third candles of a three-candle sequence:
- Candle 1: Closes at a certain level.
- Candle 2: Makes a large move in one direction.
- Candle 3: Opens beyond the range of Candle 1, leaving a price gap between Candle 1 and Candle 3.
This unfilled range is the Fair Value Gap.
When is a Fair Value Gap formed?
The FVG typically appears during moments of high volatility:
- Economic news
- Session openings (especially the New York AM)
- Breakouts of key structures (induced liquidity)
The important thing here is to understand that not all FVGs are the same. An FVG, to be valid from the ICT perspective, must be backed by an institutional move, that is, one that has sought liquidity (induced liquidity, stop hunts, etc.) before decisively moving in one direction.
In other words, it's not just about seeing a gap, it's about understanding the context that precedes it and what the price is trying to do by leaving that gap.
This last point is very important, an FVG is relevant in specific contexts and is completely irrelevant in other contexts. To make it clear, an FVG is like a hammer, a tool, if you don't know where and how to strike, it will be of no use to you.
How to identify a Fair Value Gap?
To explain this we will use TradingView as an example.
In TradingView, identifying an FVG is relatively simple if you know what to look for:
Observe three consecutive candles.
- If the low of candle 1 is above the high of candle 3, you have a bearish FVG.
- If the high of candle 1 is below the low of candle 3, you have a bullish FVG.
In the following image, you can see both cases, in blue the bullish ones and in red the bearish ones.
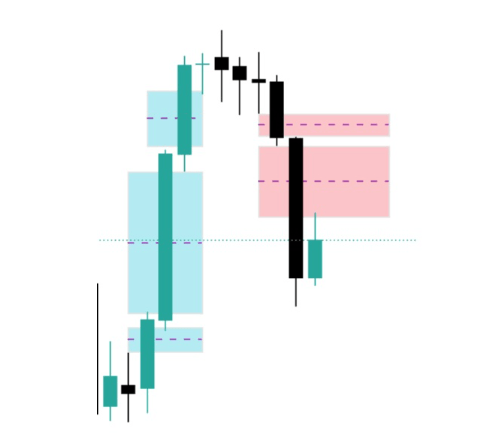
You can mark that space between the candles as a rectangular area, and you will notice that many times the price returns to that area, reacts, and continues its movement.
It is an area of institutional interest.
As mentioned before, not all FVGs are relevant. You must understand what the price was explaining to you before the FVG and assume that it is only the confirmation of the smart money's intention.
How to use the Fair Value Gap in Trading Strategies?
This is where things get really interesting. The FVG is not just a structural curiosity. It is a powerful operational tool as it implies intention but that intention can be genuine or an intention of deception.
Pay close attention to what´s been mentioned, an FVG can be a confirmation of manipulation (a deception), this is one of the most powerful uses of the FVG, detecting deceptions.
Intention of Deception
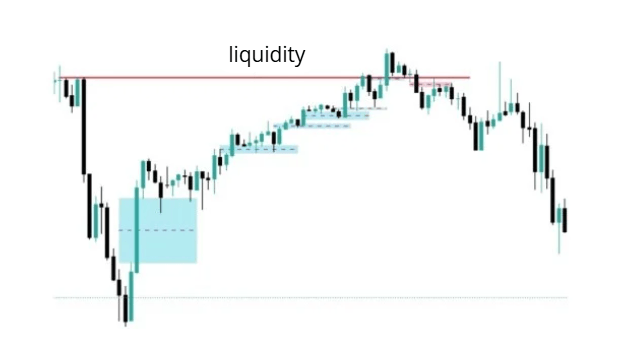
In that case, we need two FVGs: the one that deceives and the one that undoes the deception. We will almost always find this configuration in liquidity grabs.
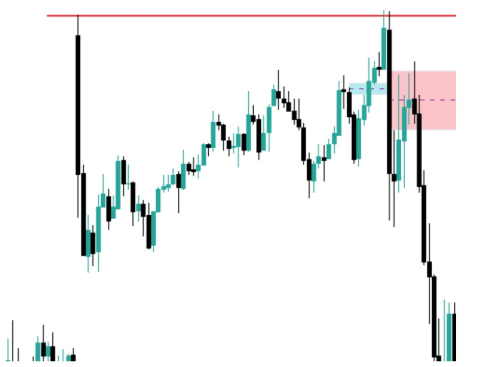
In the following image (Nasdaq TF 15 minutes) you can see an upward movement with FVG that quickly turns leaving a downward FVG and a bunch of trapped buyers.
Taking Liquidity
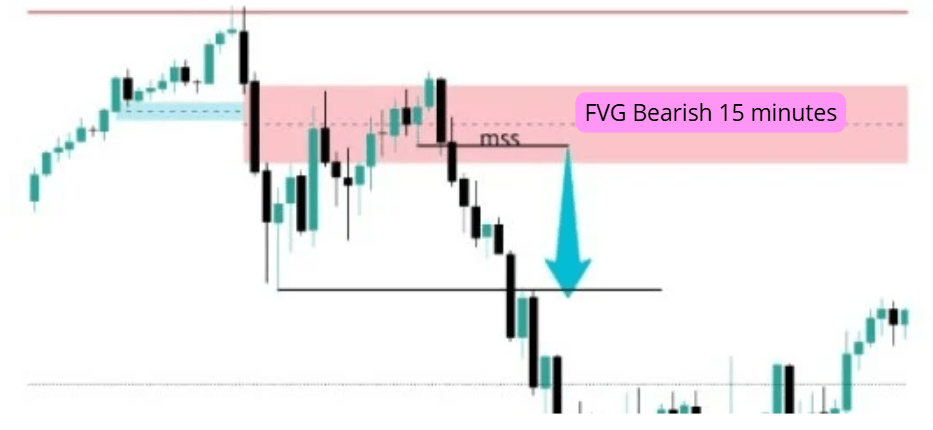
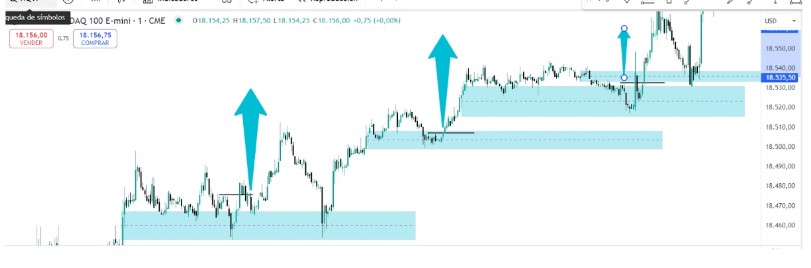
In this case, we will enter when the price returns to the intention FVG. Ideally, you should lower the timeframe and use a structure change to enter. In the following image, you can see what happened in 5 minutes, a structure change that gave us entry up to the external liquidity.
That's why this deception deserves two reflections:
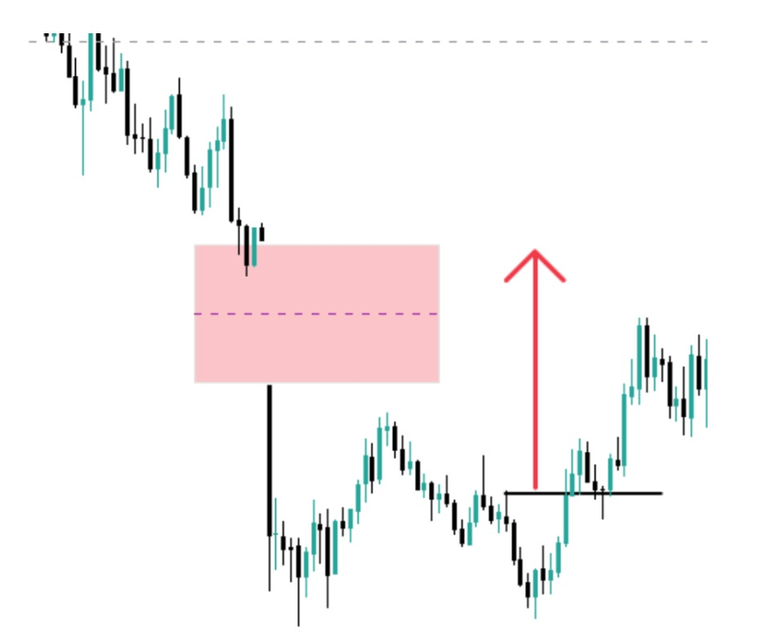
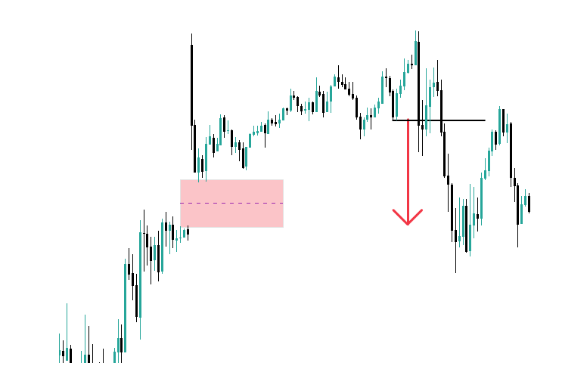
- First Fair Value Gap (the blue one): You know it was a deception and not a genuine intention because when the price revisits that area (the blue rectangle), it breaks through with a lot of intention, and doesn't just support it to continue rising.
- Second Fair Value Gap (the red one): In this case, the price leaves a structure of FVG again (having lowered the timeframe, it is perfectly visible). And well, more or less when the price returns to touch it, it reaches the highest part of the red memory, but it is barely able to surpass it, and then it sinks downwards.
Genuine Intention
As the price moves in a trend, it leaves FVG, those FVGs indicate that the trend is healthy and corrections to those FVG are the entry zones until the price reaches a liquidity zone. There we must be careful as we could be in the case of a deception.
In the following example (Nasdaq 15 minutes) you can see the large number of bullish FVG we have during the trend. There is a last FVG that takes liquidity just after the price turns leaving a bearish FVG, at that moment we are in the case of the "deception".
In the case of genuine FVG that are heading towards liquidity, the process is the same, lower the timeframe and look for structure changes. In the following image, you can see this by lowering to a 1-minute TF. In the first case, the Stop might have been triggered, in the other two cases not anymore. The target will always be a liquidity zone
However, notice how unlike what happened in the deception. When within an uptrend, the price returns to the FVG structure and touches it to support itself -even enters it-, then continues to rise without ever leaving the structure (green boxes).
In contrast, in the deception, it not only touches the FVG structure but breaks it strongly in the opposite direction.
What are the Best Markets for FVG?
The best markets for trading Fair Value Gaps (FVGs) are those with high liquidity, clear price action, and consistent volume. These conditions allow FVGs to form more cleanly and offer better reliability when used as part of ICT or smart money trading strategies.
Forex
- Why it's ideal: The forex market is highly liquid and runs 24/5, making it perfect for spotting FVGs on multiple timeframes.
- Pairs to consider: Major pairs like EUR/USD, GBP/USD, and USD/JPY often show clean gaps due to strong institutional activity.
👉 Read here for more on the Best UK Forex brokers
Indices
- Why it's ideal: Stock indices are heavily influenced by institutional order flow and macro news, which often creates sharp moves and imbalances—key for FVG setups.
- Note: Use during major market hours (e.g. US or EU sessions) for best results.
Commodities
- Why it's ideal: Commodities like XAU/USD (Gold) and WTI crude frequently show impulsive moves and retracements, creating visible FVGs.
- Tip: These are best traded around economic data releases or geopolitical events.
Cryptocurrencies
- Why it's ideal: Crypto markets are highly volatile, often creating exaggerated price moves and imbalances, which can be exploited with FVGs.
- Caution: Due to crypto's 24/7 nature and high noise, FVGs work better on higher timeframes (e.g. 4H and above).
Stocks
- Why it's ideal: Stocks like Apple (AAPL), Microsoft (MSFT), or Tesla (TSLA) tend to react strongly to earnings, news, and institutional positioning—conditions that form reliable FVGs.
- Watch out: Gaps created by pre-market or post-market trading can sometimes distort traditional FVG logic.
What is the relationship between the FVG and the Imbalance?
Although sometimes used as synonyms, there is a subtle difference:
- The Imbalance is any imbalance between buyers and sellers. It can include more diffuse gaps.
- The Fair Value Gap, according to ICT, is a specific and precise form of imbalance.
In summary: all FVG is an imbalance, but not all imbalance is an FVG. The difference lies in the structure and the intention behind the movement.
The FVG has a clear institutional context, while an imbalance can simply be a technical void without much operational weight.
The Most Popular Imbalance: NWOG
The most typical imbalance is a Gap and among the Gaps, the most common is the NWOG (new week opening gap), the gap that forms between the Friday close and the Sunday open.
The New Week Opening Gap (NWOG) is a real and commonly referenced gap, especially in Forex and indices where trading resumes after the weekend.
The NWOG, in itself, is not a tool, it has nothing to do with FVGs, it is much more important as it can become a price target.
When we have a NWOG and the price moves away from it, we should not consider it at all. The NWOG becomes a target as soon as the price points to it and starts moving towards it, it is one of the most probable entries that exist.
We know that the price is heading towards it because we have a change of structure in 5 / 15-minute charts and the price goes from moving away to pointing at it. In the following image, you can see what happened with the last two NWOGs of the Nasdaq 07/04/2025 and 14/04/2025. The goal is always to close the Gap.
Is it worth knowing and using the Fair Value Gap strategy in ICT Trading?
The answer is a resounding yes. Mastering the FVG not only allows you to anticipate price movements more clearly, but it also gives you a real operational advantage by aligning with institutional behavior.
It's not about trading every FVG you see, but about using this concept as part of a broader framework: liquidity, market structure, timing, and psychology. When done right, the FVG stops being a theory and becomes a precision tool in your arsenal.
FAQs
Is FVG trading beginner-friendly?
FVG is best approached with foundational knowledge of price action and ICT tools, so practice on a demo account first for confidence and control.
Which timeframe works best for FVGs?
Higher timeframes such as 1H, 4H, or Daily are more reliable due to clearer institutional activity.
Are indicators reliable for FVG detection?
Built-in indicators exist, but manual chart reading tends to be more accurate—especially in volatile scenarios.
Do FVGs apply to all markets?
Yes—FVGs are visible in any liquid market, from forex to commodities and crypto, though they’re more frequent in fast-moving instruments.
What’s the link between FVGs and market structure?
FVGs highlight inefficient price zones created by smart money. They are used in conjunction with market structure, liquidity zones, and order blocks to inform precise entries.